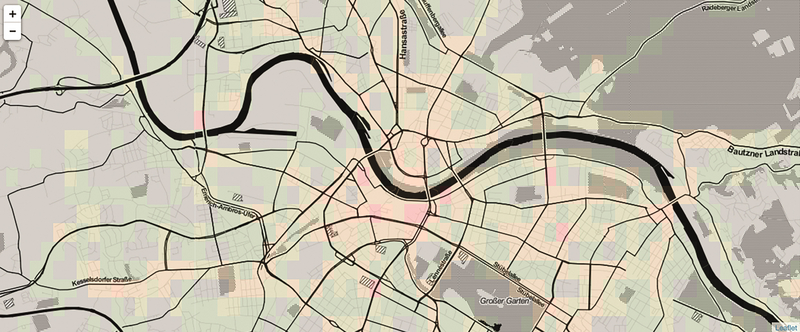
Traffic Heatmap Service
Our Heatmap application aggregates GPS signals send by taxi cabs in the city of Dresden in a rectagular grid. The user can choose between displaying an aggregation of the number of signals and the average speed with different at different scale. The application should help drivers and companies to plan their daily trips by providing an interactive web map visualization which is easy to read and to use. Within the ExCELL project we will extend this solution to a web service where a user can create his own heatmaps selecting different data sources, hot spot analysis methods and display forms. Computation is done by Apache Spark and Apache Impala.
Route Blocker
Dresden Route Blocker is a web map application to demonstrate which alternative routes taxi cabs would take in case of sudden block events on certain streets. The data represents historic Floating Car Data (FCD) from a taxi company of Dresden. The origin and destination of single trips were used to feed a routing engine (Graphhopper). The retrieved track is animated using the D3.js library. If a user clicks into the map a route blocking service from the ExCELL plattform is called which also triggers a rerouting of all currently running trips. If a road intersects a route of a taxi, the user will see, that the car will take another way to drive around the blocked network element.
With this interactive component the user understands, how the ExCELL plattform enables for smart mobility and transportation management in real-time.
Click here to learn more about the app.
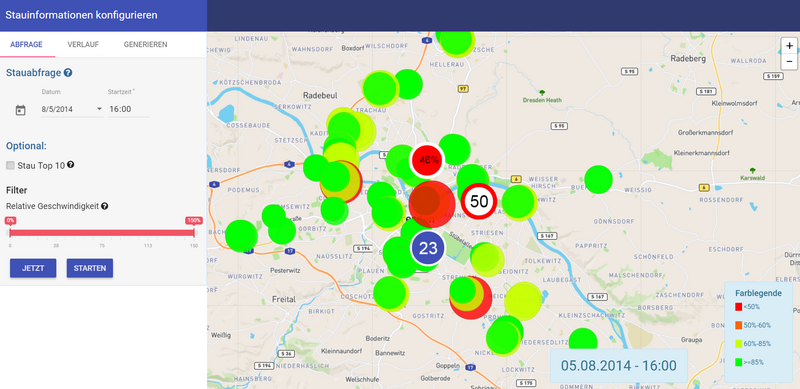
Stauatlas
The Stauatlas is a web application that visualizes the traffic at road sensors in the city of Dresden. Therefore, we applied data from the year 2014 and analyzed the maximum speed at road segments to recognize traffic jams. If the average speed at a specific sensor is below a certain threshold, our Stauatlas shows an orange or red colored scale. With the help of the Stauatlas, city planners and commuters have an application to find areas and roads with a high traffic volume. In the future, we want to use live streaming data to feed into our Stauatlas ETL pipeline. Additionally, we are planning to implement our Stauatlas in other cities.
You can test the Stauatlas here.
3D Space Time Hot Spot Analysis
Our group participated at the SIGSPATIAL GISCUP 2016 where a statistical hot spot should be calculated on top of 1 billion taxi drop offs in New York. The challenge required to provide a programm executable on a Hadoop cluster using the distributed execution framework Apache Spark. The result is one csv file which contains statisical parameters for all cells of a 3D grid, where the third dimension is represented by the time devided by 2 hours. The spatial dimensions are devided by 200m.
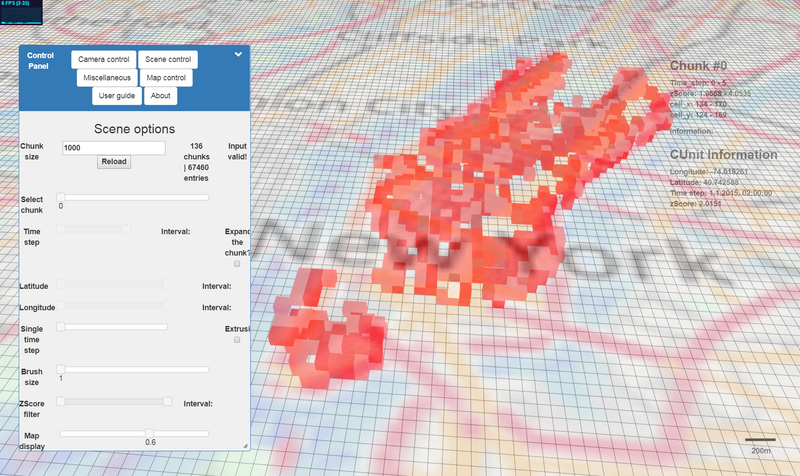
At first, we tried to display the result on a plane map, where the change over time can only be accessed via a slider. For an intership project of our exchange student Minh Hoang DANG we wanted to build a 3D application to make the occurance of space time hot spots directly visible. The app was build with Three.js, a powerful WebGL library to render 3D graphics in the web browser. The current state can be viewed here.
The app should be viewed with the Google Chrome browser. Go to scene control, type in a chunk size and load the data. With the chunk slider you should be able to see the hot spots and how they change over time. While the app gives you a nice perspective of the distribution of clusters, the navigation is still very tricky to provide closer insights.
